Hacking a Native Mobile Feature with JavaScript
Clever and efficient development tricks to quickly prototype a mobile-first MVP
I dove into the unknown with my team, and we devised a technically innovative, user-centric, and data-validated solution that was successful on its own and valuable for the longer term product roadmap.
Acorns is a fintech app that encourages users to save and invest small increments of money. It is aimed at low- or moderate-income users with a beginner-friendly interface.
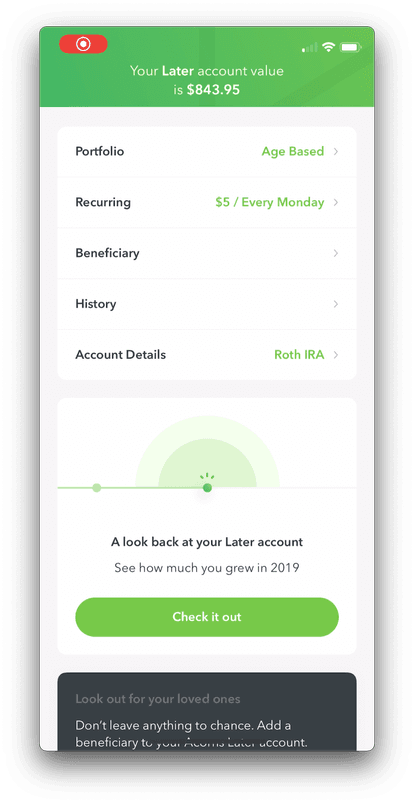
Acorns has an retirement IRA product called Later. Customers typically fund their Later account with small amounts of money, usually $5-$20 on a weekly or monthly basis. Of course, this money still adds up significantly over time. I was on the Later team as a frontend developer. During a team ideation session, a colleague and I came up with the idea to do a year-in-review feature a la the Spotify Wrapped feature.
You’ve probably seen or heard of this feature. At the end of each year, Spotify packages up your listening data and presents it in a fun, interactive interface. It gets shared heavily on social media and has become quite a cultural touchstone.
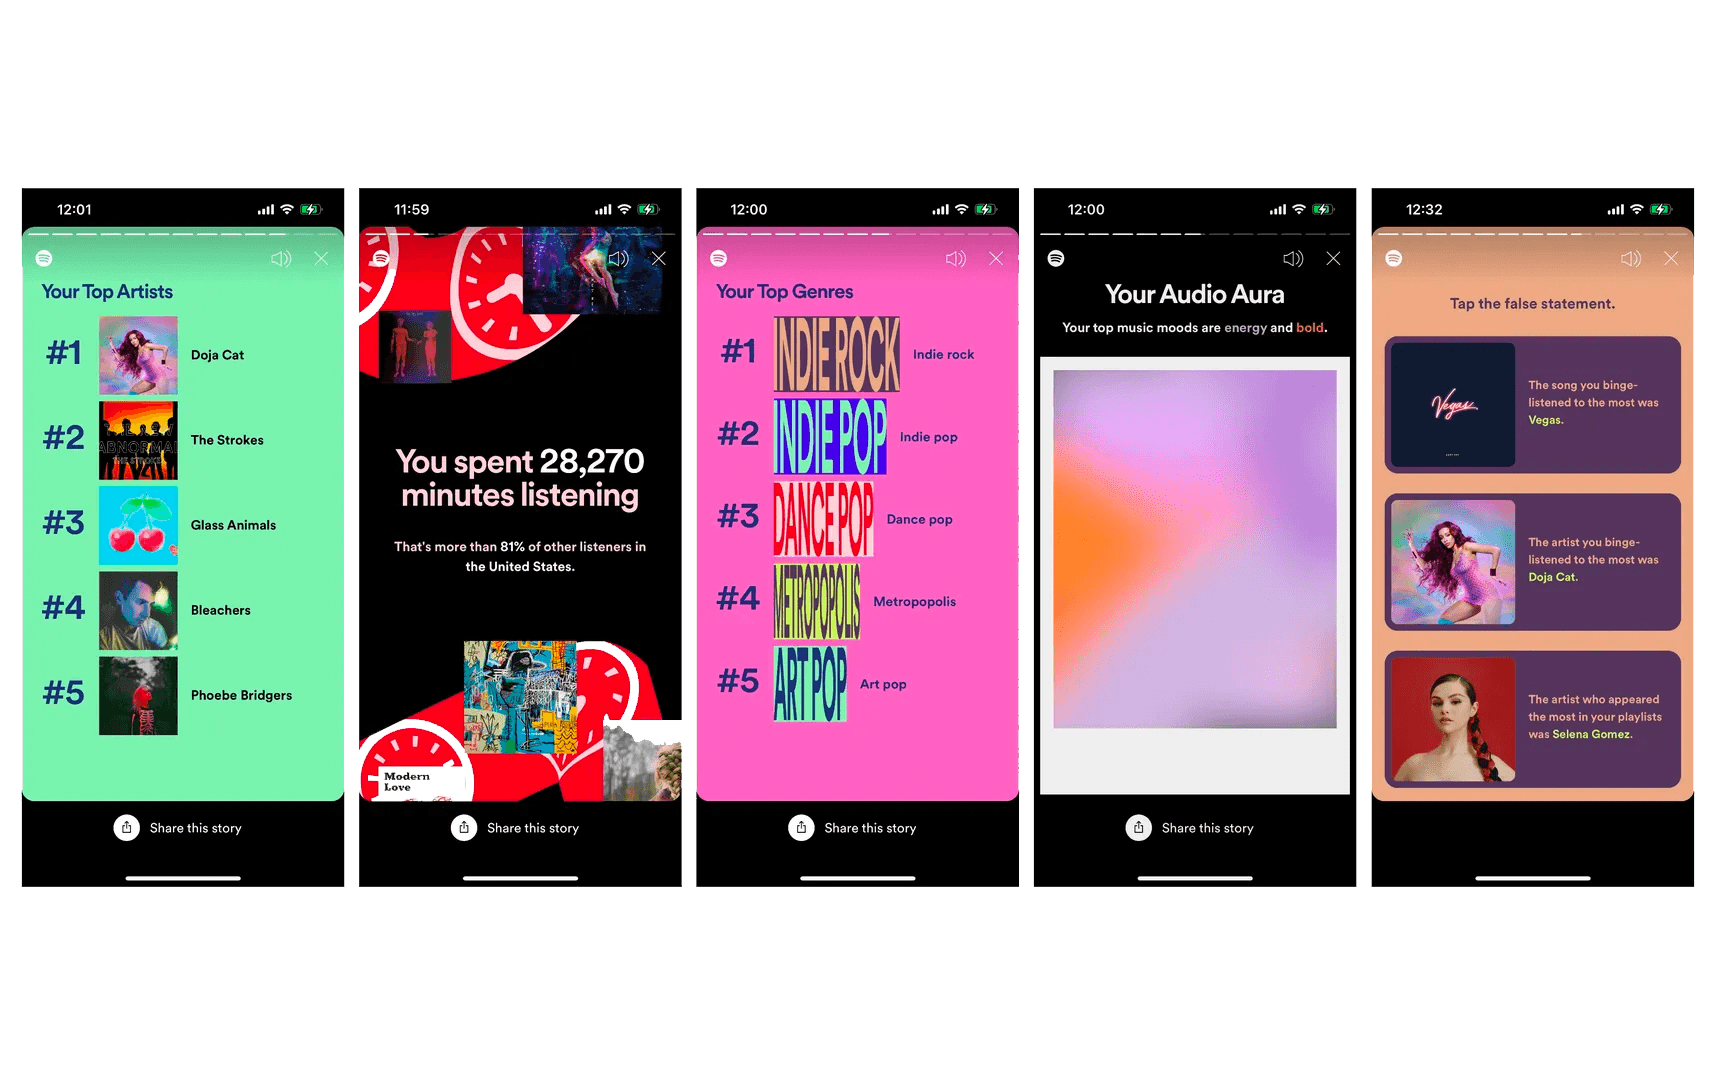
We wanted to produce something similar that celebrated our customers’ savings achievements, but also take it a step further and include a call-to-action that encouraged users to increase their contribution rate for the new year in the spirit of ‘New Years resolutions’. This would be a business win by increasing “Assets Under Management” which was a key north star metric for Acorns.
It turned out that this sort of project had been kicked around at higher levels (the Spotify Wrapped feature is impossible to miss, after all), but it was considered too risky to build an unproven large feature across all product verticals. However, with our idea proposal, my PM recognized an opportunity to build a small version of this feature for the Later vertical only, as a proof-of-concept with limited resources. If it was successful, we could take what we learned and build a bigger version the following year.
This brings us to our problem statement:
We had to be lean and mean with this project. We were limited to two developers: myself and my colleague who was also a front-end specialist. We got some input from backend and design as needed, but essentially built this ourselves. We also had only one month to get it done before year’s end.
As my colleague and I were both FE devs, our medium of choice was JavaScript. In this medium we could create a rich email experience (but email conversion rates were notably much lower than other channels), or a webapp-based experience (but the vast majority of our customers were mobile-first). Neither of these were great options, so it was time to get creative.
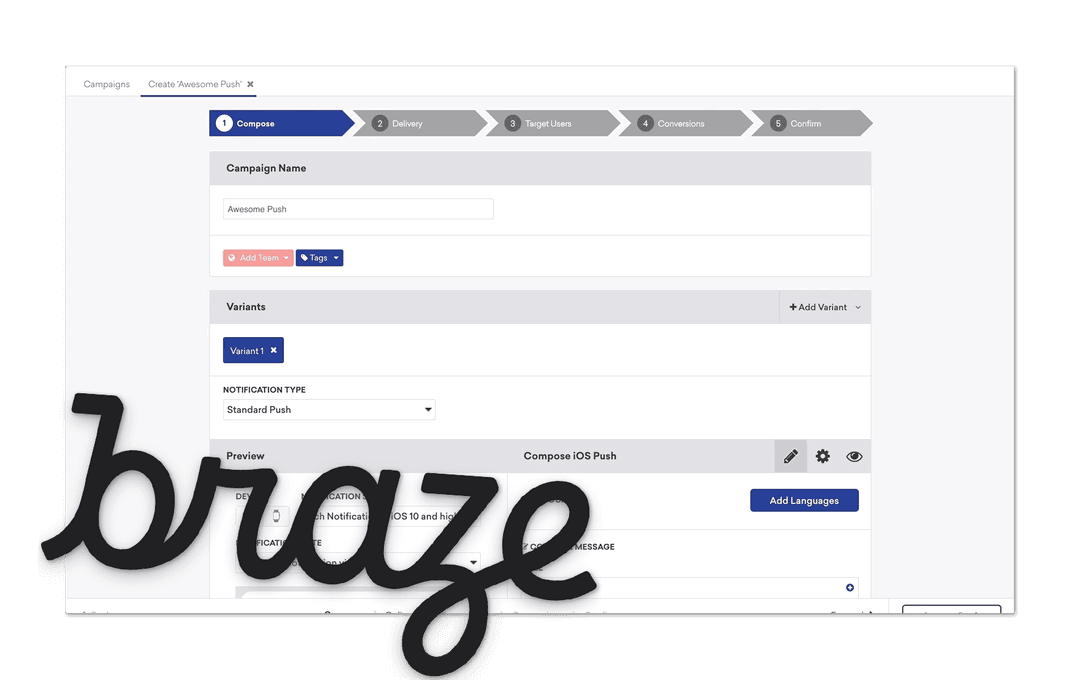
I had begun learning the marketing platform Braze a few months prior. It was built into both our iOS and Android native apps and allowed the marketing team to create campaigns that used push notifications, popups, and in-app screen takeovers.
They’re generally made with static images, though it’s possible to use HTML and CSS. I had worked with the marketing team on an earlier project to do some fancy CSS animations for a promo, and while I was in there, I noticed that it was also possible to drop in custom JS to the in-app takeover interface. It wasn’t well-documented at the time, but it was possible to run little scripts and such.
So I wondered.. just how much JavaScript is it possible to pack in there?
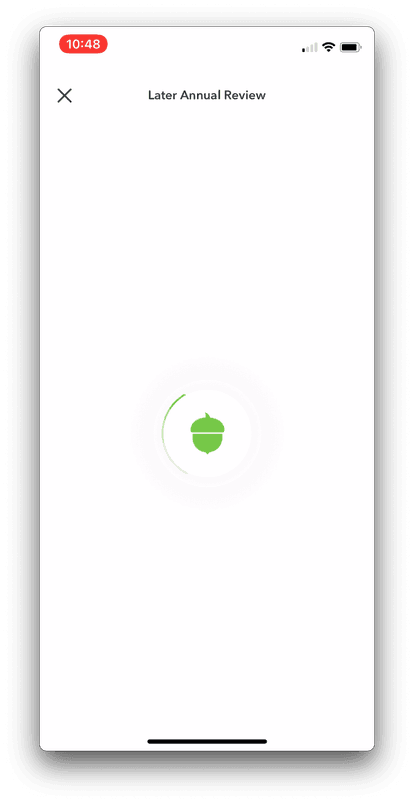
It turns out- a lot! We built the Year Later Report feature as a custom one-off webview in a rapid development process using a no-framework JS method. We used HTML, CSS, JS, GraphQL, Google Analytics, Slick, and Fabric, and I was even able to drop in a Lottie animation to get a cool loading spinner.
I packaged that all up, loaded it into a Braze in-app-takeover campaign, and pressed go. Just like that, our code was available on both native platforms with no builds or App Store releases required.
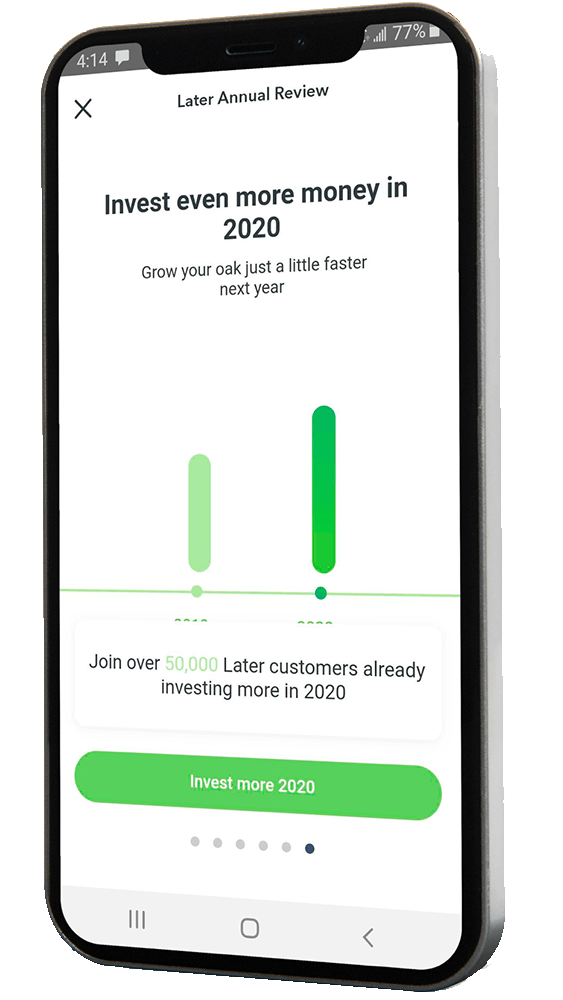
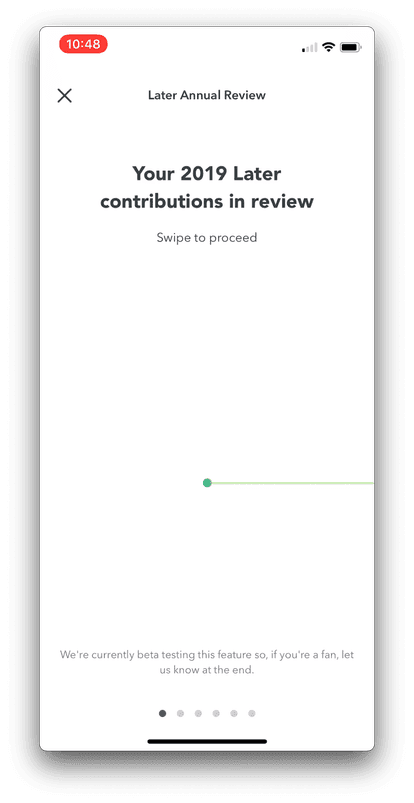
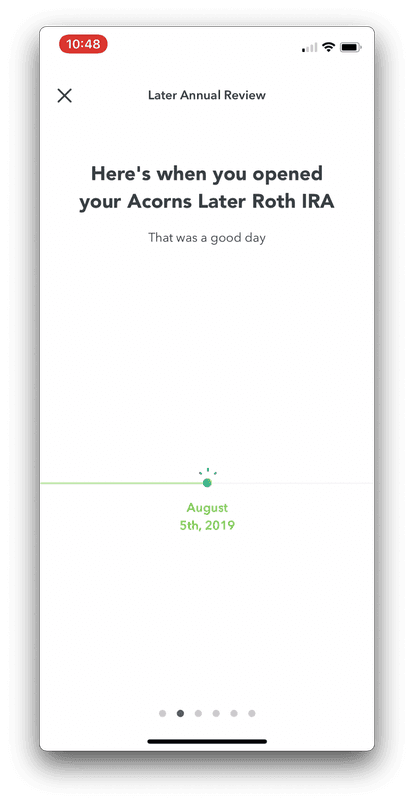
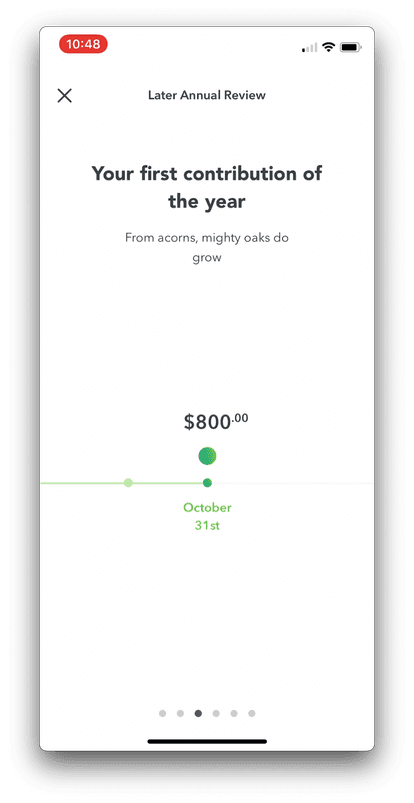
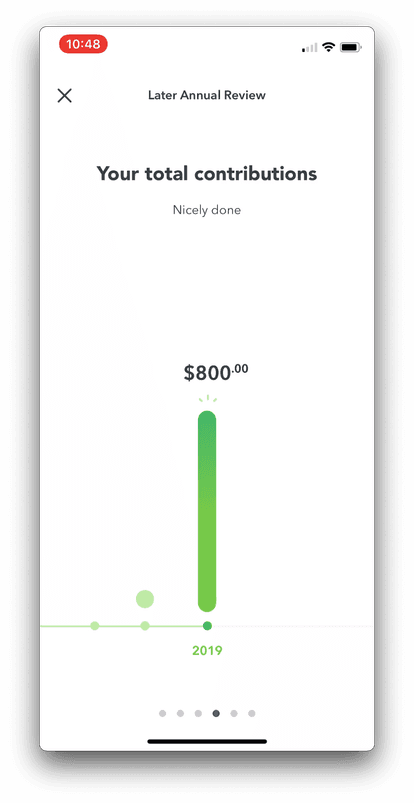
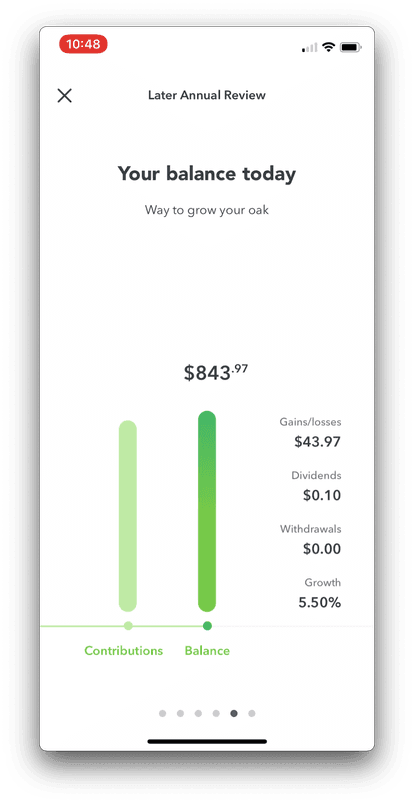
The userflow is a simple journey that that was created by our team's UX designer. We built it out using the carousel library and canvas animations. It takes the form of a timeline telling you the story of all the milestones associated with your IRA account.
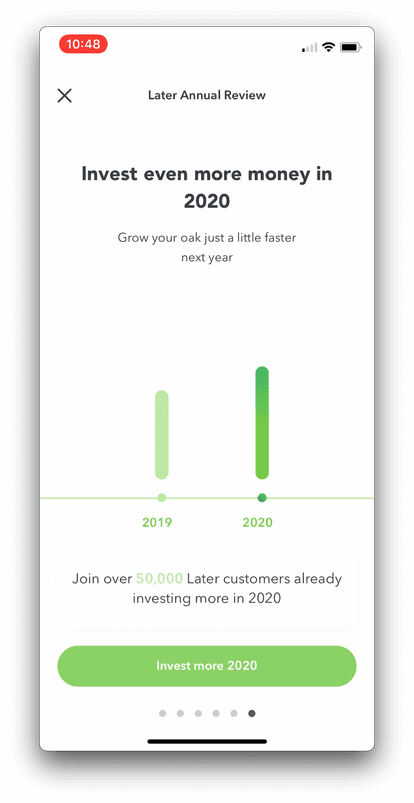
There's an interactive picker interface written in lightweight raw JS that shows an increasing potential graph as the amount is toggled up.
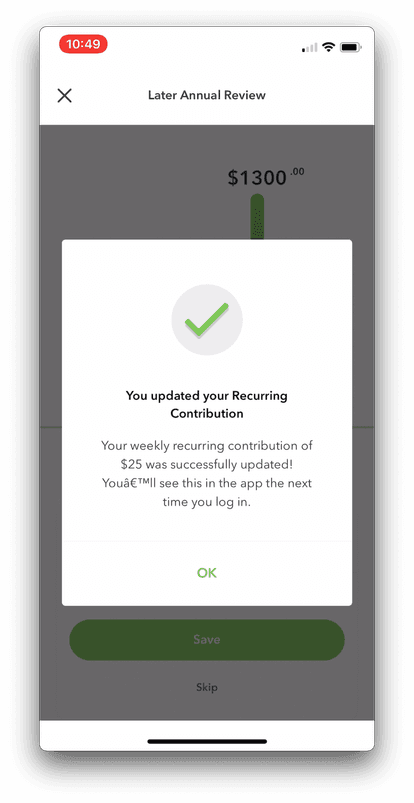
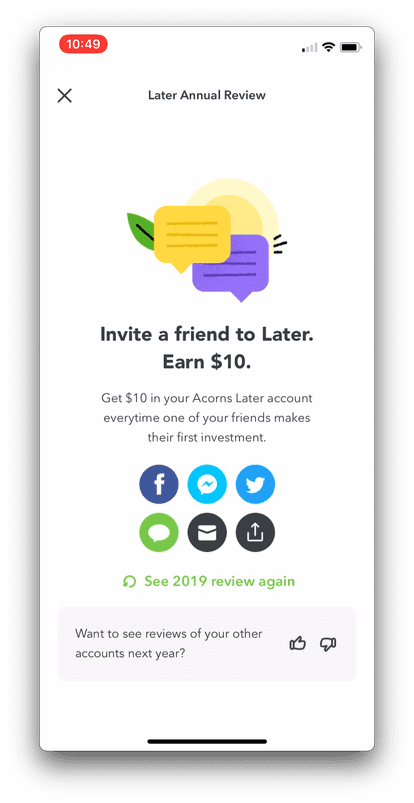
The end of the flow leaves with you a CTA to increase your investment contribution the following year. Finally, if you complete the CTA action, you get a confirmation modal (again, which looks native) and a social share screen as well as a replay button.
I worked closely with the designer in a tight feedback loop to tune the visuals of the interaction. We met our deadline and released the feature in time for the year-end marketing push.
Since we were using this as an MVP with the purpose of learning, it was very important that we added analytics and judged its success. In the spirit of keeping things lightweight, I added simple Google Analytics event tracking on a per-screen basis and set up a metrics collection system.
Our primary success metric was increase in assets under management (AUM) which was a key North Star metric for the Acorns business.
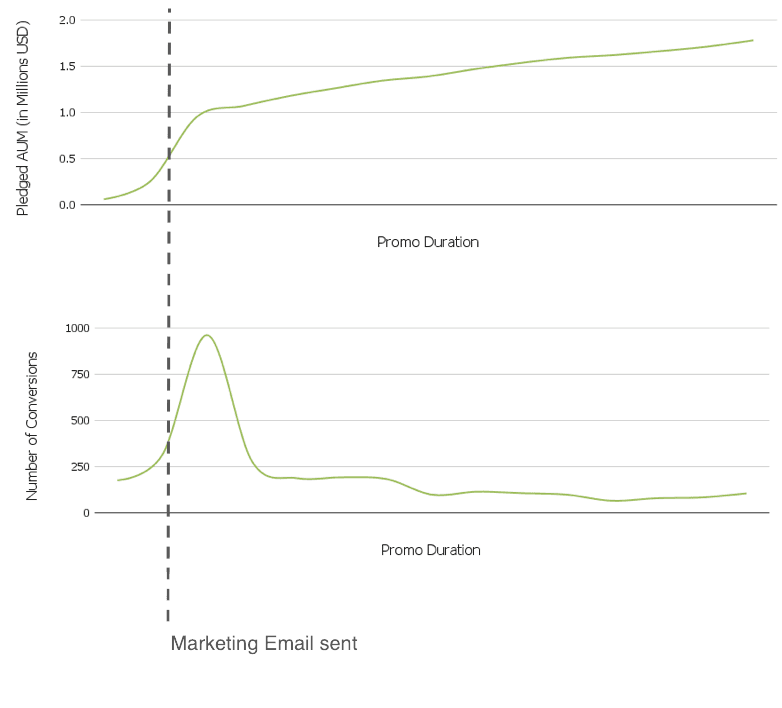
We had excellent audience engagement metrics, with over 1% of customers completing the flow and making increases to their Later recurring investment settings. 3,591 customers pledged to increase their investments over the two week promo period, which resulted in almost $1,779,649.81 increase in pledged AUM. That’s an average of $495.59 per customer increasing their investment in their future through Acorns. That may not sound like a lot, but our average account balance was around $1200, so it marks a significant increase.
The Year Later Report feature was significantly more impactful than previous short-term promo features that Acorns had released. We believe the project's success came down to a few key points:
As mentioned, I put analytics on the funnel itself to learn more about how users interacted with the feature. We had good retention through the storytelling screens, and then noticed a significant amount of dropoff on the CTA step:
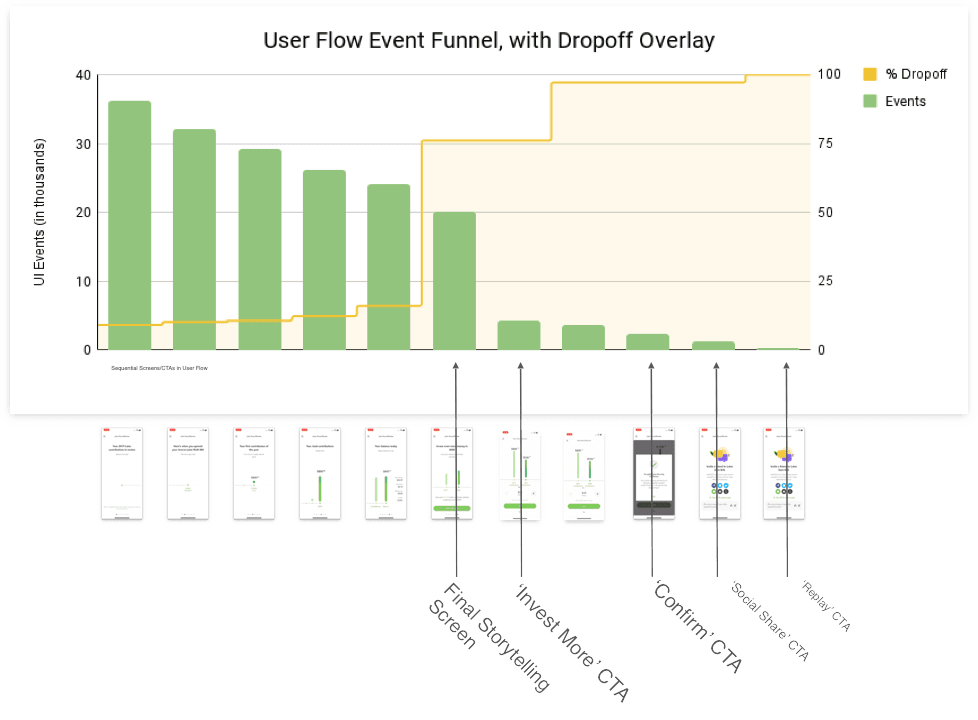
If we had more time/resources for this project, I would recommend doing some experimentation or A/B testing at this step to understand if any techniques can improve conversion on the CTA. I’d also probably show this to the designer and ask if we should consider limiting the number of storytelling screens, since there was a consistent ~10% dropoff at each screen.
This case study highlights the value of taking calculated risks to prove concepts at a small but effective scale. My team identified an opportunity to build, gather data, and learn on a super short timeline with minimal resources. Our result not only proved valuable in itself by increasing Acorns' AUM, but we paved the way for a bigger feature with much wider reach that could provide even more value in the future.
This project also emphasizes the importance of approaching problems with an open and curious mindset. When I first learned about Braze I wrote it off as 'just a marketing tool', but it was pivotal in allowing us to deliver the Year Later Report feature to our mobile customers rapidly and efficiently. I love to use my programming and technical skills in novel ways to explore problems and create delightful experiences for others.